Fairness design model
Summary
The Fairness design model is a visual / graphical representation showing the myriad relationships inherent between Effort (E) needed of issuers to produce a form and users to fill in that form, and the Opportunities (O) provided by issuers that are utilised by users to complete the form.
The Fairness design model expresses the relationships between E and O as a series of equations that correspond to concomitant scenarios in the design process. The equations are then graphed to visualise each scenario and identify zones of fairness, which occur under conditions when E ≅ O.
To understand these relationships, we need to first consider the principles of inequality, equality, fairness, and fairness design. As such, we begin with a comparative analysis of these 4 principles, each illustrated to show similarities and key differences in their applications.
Click the reference box below to copy the citation for this webpage:
Khara, A. (2022) Fairness Design Model. Available at: www.fairness.design/model (Accessed: ).
Reference copied to clipboard
1. Inequality, Equality, Fairness, and Fairness Design
Fairness design is predicated on the notion that every user filling out a digital government form ought to have the same possibility of success in completing the process as every other user. The design opportunities afforded to users should therefore be independent of the presence of immanent abilities that more advantaged users will possess, such as better digital literacy, default language fluency, or greater access to advanced digital infrastructures. In other words, these opportunities should give every user the same chance of completing the process, regardless of any individual capabilities or handicaps.
Assuming also users and issuers are seeking to participate cooperatively within a process in order to achieve their goals, then all parties must agree to the rules of that process and make certain compromises in order to mutually facilitate fairness for everyone. These acts of cooperation and compromise can be expressed in two variables: (i) effort required of users; and (ii) provision of design opportunities afforded by issuers to counterbalance this effort. As such, the model does not seek to eliminate effort, since this would neither be possible nor practical. Instead, fairness design assesses and adjusts this relationship based on providing opportunities equally for all users, but determined by the needs of the least advantaged users. This is weighed against the load placed on issuers. Hence, the model follows an optimisation process to achieve scenarios of parity for all participants.
The objective can also be expressed as an analogy to help readers better comprehend the model: if the process of filling in a form were a marathon, then fairness design would be affording every participant in the marathon an equal chance of completing the course. The intention is not about which participant reaches the finish line first, but how many are able to cross the line regardless of the number of participants.
This entails providing every marathon participant with the best possible opportunities so that everyone, from the least-skilled to the most-skilled participants, may complete the course without needing to rely on extraneous support. This does not mean participants are not allowed to use their own competencies, but rather that participants should not have to — especially if such competencies are only available to a select few. Similarly, the marathon’s organisers should not be responsible if a participant cannot complete the course due to factors outside of the organisers’ control. Instead, participants can rely fully on the internal opportunities provided by the organisers in their attempts to complete the course.
Fairness design thus emphasises that a form be designed such that the least advantaged user is given an equal chance as all other users to complete a process, which leads to the desired outcome of fairness. However, any opportunities given to the least advantaged users must not cause disadvantage to other users. Returning to the marathon metaphor, parity is achieved by giving each participant the same — i.e. best possible — opportunities to cross the finish line. To achieve this, the level of opportunities provided by issuers must be congruent to the amount of effort needed by the least advantaged users.
I use the term “congruent,” and not equal, throughout the fairness design model. This is due to differences in the nature of effort and opportunity. Both parties expend effort in the forms process, but not in the same way. Users expend effort in completing the form and therefore rely on opportunities to reduce this effort. Issuers, on the other hand, expend effort in creating these opportunities for users by drawing on more resources.
In order to achieve this parity, fairness design begins by accounting for the needs of the least advantaged users, per Rawlsian notions of fairness, but without penalising other users with stronger inherent abilities, and by acknowledging the strains on issuers in providing opportunities for the least advantaged users. This is to optimise the supply of design opportunities against the exigencies of production, costs, distribution, data collection and extraction, processing and replying, and other miscellaneous overheads. Thus, the intended outcome of fairness design is for users to benefit from enhanced form-filling experiences, and issuers to leverage greater resource efficiencies.
As discussed, the fairness design model does not ensure that every user actually completes the process. This would be impossible to achieve, given the number of variables that may prevent a process from being fully discharged. Moreover, many of these variables are beyond the purview of document design. For instance, a tourist intending to visit Singapore may not be allowed entry if they are unable to show sufficient funding to cover their trip. Likewise, a visitor to a mall may be denied access if a temperature scanner detects a fever. Such circumstances have little to do with the design of the form itself.
Fairness design therefore does not — and cannot — warrant that users will be able to achieve their desired outcome by participating in the forms process. Instead, the goal of the model is to make form-filling processes fairer through design-led interventions. Consequently, the model is not aimed at altering the speed, pleasure, or necessity of form-filling activities, although these may well be incidental outcomes; thus fairness design treats such effects as ancillary to its primary objectives.
This is not to suggest that a fairly-designed form will not ask users to rely on their own abilities to some extent. A user with absolutely no knowledge of bureaucratic procedures, for instance, will be unable to complete a form no matter how well it has been designed. Indeed, any expectations of completing the form in such a scenario would be unfair to issuers. It follows then that issuers are justified in assuming a basic threshold of knowledge, beyond which a person may reasonably qualify as a forms user. But how does an issuer determine where this threshold should start? And what qualifies as basic knowledge? Both questions are addressed by focusing on the needs of the least advantaged user. Writing on democratic equality, Rawls rejects notions of efficiency and instead prioritises the virtues of the “difference principle”, discussed above. By focusing on the needs of the least advantaged members of a society, there is potential for fair equality of opportunity.
Figures 1.1–1.5 on the following pages, extend the marathon analogy to different types of vehicles travelling over the same terrain, with all of them attempting to cross the finish line. Larger vehicles have bigger fuel tanks and therefore have an inherent advantage; correspondingly, the smallest vehicles represent the least advantaged users. The analogy illustrates the differences between inequality, equality, fairness, and fairness design. Figures 1.4 and 1.5 particularly highlight the function of fairness design as a systemic layer through which to evaluate digital government forms.
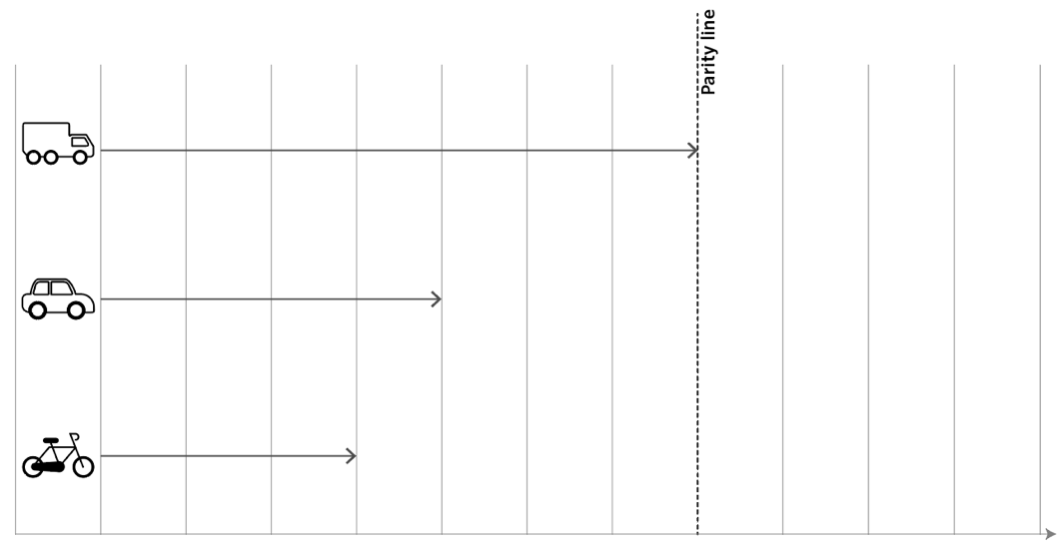
Figure 1.1: Inequality: users rely on their own circumstances in order to complete the task. This results in an unfair relationship between all users and the issuer.
Figure 1.1 above shows three vehicles, representing users, from the most advantaged (electric truck) to the least advantaged (electric cycle) in terms of charge-carrying capacity and therefore the ability to travel a certain distance in a single attempt. The dashed vertical rule represents the parity line i.e. the finish line which all users ought to be able to cross as a result of the design opportunities afforded in the form.
Figure 1.1 illustrates conditions of inequality: there are no opportunities provided and so each user has to rely on their inherent circumstances in order to complete the task. The result is an unequal scenario since users with greater inherent abilities, i.e. the electric truck and to a lesser extent the electric car, have a greater advantage. However, the less advantaged and least advantaged users, i.e. the car and the cycle respectively, lack the abilities needed to reach the parity line without additional design opportunities from the issuer. However, all three user types have an unequal relationship with the organiser of the journey, i.e. the issuer.
Such inequalities, at least in society, are typically fixed by governments providing equal opportunities for all users. But supplying equal opportunities does not necessarily help less advantaged users, as illustrated in Figure 1.2 below.
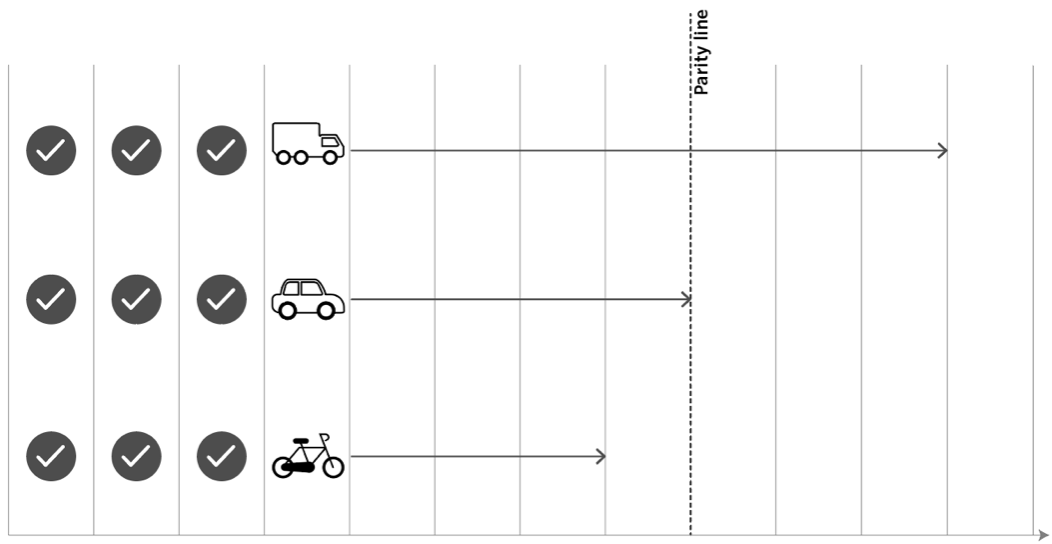
Figure 1.2: Equality: each user is given the same opportunities as all other users but without regard to the needs of the least advantaged user. This results in an unfair relationship between less/least advantaged users and the issuer.
Figure 1.2 above illustrates a scenario of equality: all users are given equal opportunities, regardless of their individual or inherent circumstances. The result, however, is an inequitable possibility of outcome for every user. This is because some users still lack the necessary abilities and are consequently unable to reach the parity line without additional opportunities.
The diagram shows that the provision of equal opportunities attempts to reduce inequality by giving all users added help. But without considering the needs of the least advantaged user, this provision ultimately risks becoming an exclusionary policy for those facing the severest limitations. The relationship between the least advantaged user and the issuer therefore remains unfair.
Another way then to create conditions of fairness would be through the allocation of opportunities relative to each user’s individual needs. This corresponds with Rawls’ principle of allocative justice. Figure 1.3 below illustrates this scenario under conditions of fairness
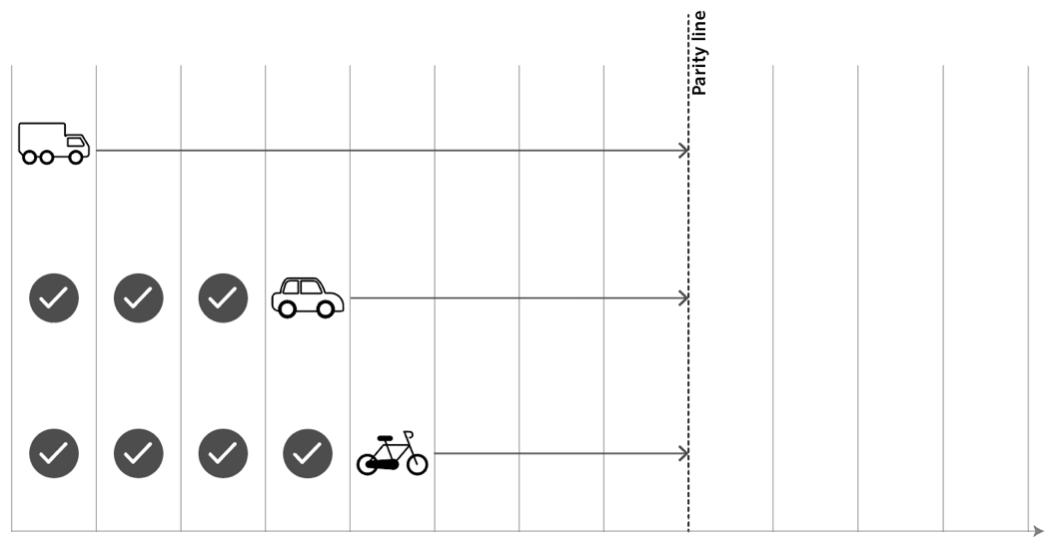
Figure 1.3: Fairness: opportunities are allocated according to individual needs. This results in a fair relationship between all users and the issuer. However, this scenario does not apply to forms design since users with greater inherent abilities cannot be penalised.
Figure 1.3 above illustrates a scenario of fairness: each user is provided with opportunities commensurate with their inherent circumstances. The result is equitable participation for all users since every user has been allocated the opportunities needed to be able to reach the parity line.
In this scenario, allocation appears to be the ideal solution to achieve a fair outcome for all users. But this situation is suitable for addressing issues related to gender, racial, and wealth disparities, whereby resources may be accordingly reallocated to create more equality. This cannot be the case for forms design since — unlike wealth or employment, where taxation and hiring policies are used to reallocate resources — a user cannot be penalised for possessing a greater level of inherent abilities than another user.
Similarly, when completing government forms there is no rational reason to penalise users with stronger skills. Hence, the notion of allocative efficiencies is not applicable to form design. Instead, fairness design requires an approach that considers the needs of the least advantaged user, as shown in Figure 1.4 below.
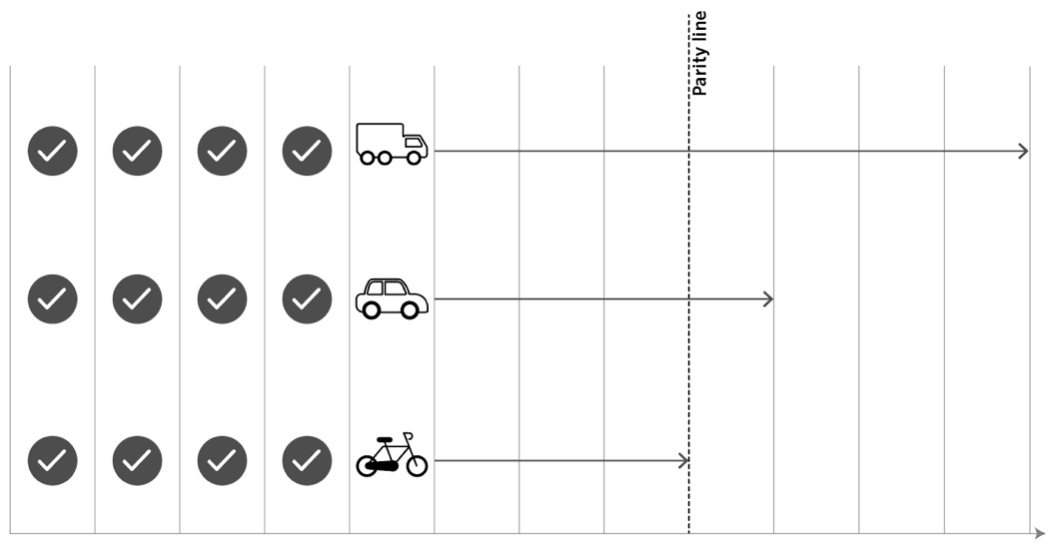
Figure 1.4: Fairness design (user-only perspective): opportunities are given to each user based on the needs of the least advantaged user. However, this scenario assumes opportunities are limitless and therefore does not take into consideration the needs of issuers. This results in unfairness to issuers.
Figure 1.4 above illustrates a scenario of user-driven fairness design: all users are given the same opportunities, regardless of their inherent circumstances. The quantity of opportunities is decided based on the needs of the least advantaged user, i.e. the cycle. The result is that every user is given the same chance to reach the parity line.
Moreover, no penalties are levied on users possessing inherent abilities. In a sense this represents the ideal scenario for fairness from a user’s perspective. However, this scenario gives no consideration to issuer loading since it assumes issuers are able to provide limitless design opportunities. This makes the process unfair for form issuers. Additionally, supplying excessive opportunities risks raising complexity levels by increasing cognitive loading among more advantaged users.
It follows then that both, user and issuer needs be taken into account for the fairness design model to be effective. This means setting the parity line at a position in which the provision of opportunities meets the effort required by the least advantaged user, but which also balances out issuer exigencies. Figure 1.5 below thus illustrates the best-case scenario for Fairness Design
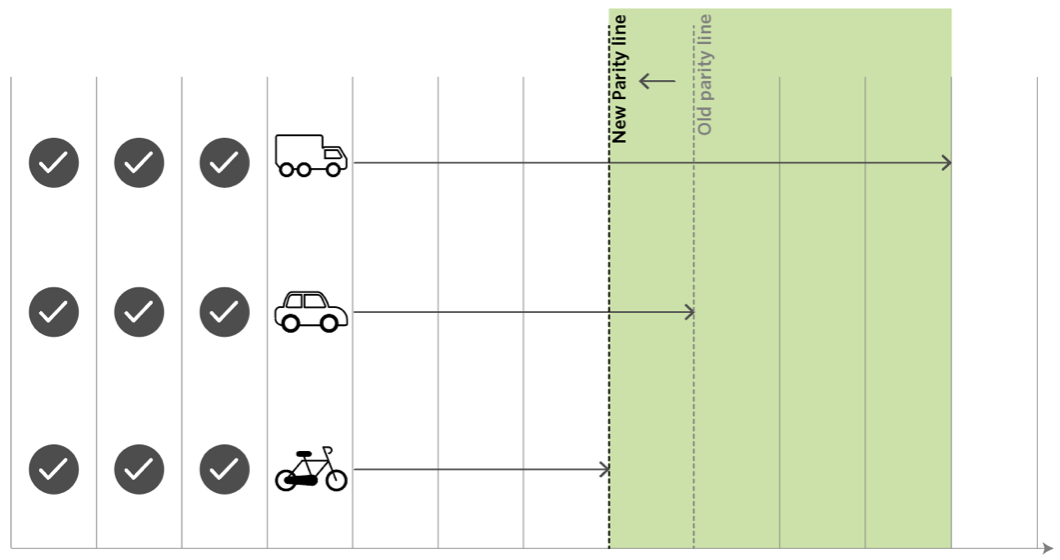
Figure 1.5: Fairness in design (balanced user-issuer relationship): opportunities are given to each user based on the needs of the least advantaged user. This scenario also accounts for issuer exigencies. Users and issuers agree to a cooperative exchange, resulting in a new parity line and fairness zone. This results in fairness for all parties.
Figure 1.5 illustrates a scenario of fairness in designing digital forms: every user is given equal opportunities — regardless of inherent circumstances — but allocation is based on the needs of the least advantaged user. The result is that each user is given the same chance to reach the parity line, with no penalties being levied on users who possess greater inherent abilities.
Consideration is also given to issuer loading. Users and issuers reach an agreement under cooperative conditions that balances design opportunities — rationally needed to reduce effort — against what issuers are realistically able to provide. Thus, optimum provision of design opportunities is supplied which saves resources for issuers while helping the least advantaged users reach the parity line. This approach also prevents greater cognitive loading among most advantaged users. Consequently, a fairness design zone — shown in green — is established.
The scenarios presented in Figures 1.1–1.5 thus illustrate the differences between inequality, equality, fairness, and fairness design. Figure 6.5 shows the optimal conditions under which the fairness design model operates. However, these figures do not discuss the essence of the relationship between users and issuers. This relationship is defined by equating effort needed to opportunities provided. The results of this equation are a set of expressions that plot Effort (E) against Opportunities (O) — thus forming the basis for the fairness design model — and are discussed in the next section.
2. Equating Effort (E) to Opportunities (O)
Fairness design correlates effort against design opportunities needed by the least advantaged user to ensure an equitable chance of success for all users to compete the process. In the context of government forms, unfairness is the incongruence between the effort needed, and the availability of design opportunities to reduce this effort. Effort refers collectively to the amount of work and resources needed by users to complete the form. Likewise, effort also includes the output required of issuers in providing design opportunities in the form.
Provision of these opportunities reduces the effort required by users, but increases the workload of issuers; conversely, the absence of opportunities makes it easier for issuers but more arduous for users. As such, Effort (E) and Opportunities (O) encapsulate the relationship inherent between forms issuers and users. Accordingly, a balance is required between these two variables in order to establish fairness for both parties.
This relationship manifests itself in five possible scenarios whereby effort equals to, falls short of, or exceeds design opportunities. Table 2.1 below shows this relationship expressed in the five scenarios. These scenarios mediate the interactions between issuers and users and thus form the basis for applying the fairness design model.
Table 2.1: List of five possible Effort/Opportunities scenarios, with various outcomes for fairness design and user experience.
Fairness design leading to E ≡ O
This is the ideal situation where effort required by the least advantaged user is congruent to design opportunities provided by issuers. Issuer exigencies have also been taken into consideration in determining the position of the parity line. Users and issuers are thus expected to respond to the form cooperatively and in an agreed upon manner, which yields a fair forms environment. It must be noted that the E ≡ O scenario is not as much a point in the relationship but a zone of fairness.
Failure of literacy opportunities leading to E ≢ O
Several problems, for example inadequate literacy or awareness of bureaucratic procedures, can be expressed in an E ≢ O scenario, whereby effort and opportunities are incongruent. Accordingly, most cases of E ≢ O are in effect E > O. Immigrants and refugees with limited literacy skills and language fluency are therefore at greater risk of encountering problems with government offices. In this case, without literacy opportunities designed into government forms — via auto-translations or supporting literature that offers options for assistance — the possibility of a E > O scenario is high. The absence of such opportunities compels additional effort since users need to rely on external mechanisms to complete the forms process. It follows that opportunities of literacy for refugees become these trusted mediators. (To a lesser extent there are also cases where excessive opportunities threaten to overwhelm users, leading to E < O scenarios. Excessive amounts of information, for instance asking users to check their details multiple times or complete several captcha attempts, lead not only to clutter but greater possibility for errors through overcompensating and cognitive overloading).
Failure of clarity opportunities leading to E ≢ O
Analyses of digital forms have repeatedly revealed considerable gaps in accessibility, notably for visually impaired users. This is namely due to the titles in the breadcrumb trail, which are not links and so will not be inferred by screen readers as a trail. Likewise, the text size remains fixed across all screen widths; there is no built-in feature to adjust the size of the form’s textual elements, other than relying on browser controls. This causes clarity problems for visually impaired users — who rely on voice over and screenreader technologies, and larger type sizes — thereby leading to an E > O scenario. Other issues include dense language in the declaration section for health, failure to implement proper navigation for users to track back and forth across different sections of the form, and intense colour-coded error messages that overwhelm the screen. Collectively, these discrepancies risk causing confusion and thus exert a greater toll on users.
Failure of technology opportunities leading to E ≢ O
While governments may strive to facilitate greater accountability and ease of clarity, the technology factors within the user’s domain — including bandwidth speeds, modern browsers, and security, privacy, trust, accessibility and service quality — can affect the satisfaction felt towards e-government services. Users with modern browsers, for example, may benefit from updated scripts and greater integrations with online tools, thus reducing complexity issues. Digital forms optimised for such environments, however, need to also function in slower or outdated browsers through backward compatibility and improved technical processes that bring about fairer conditions for all users.
Summary of the five Effort/Opportunities scenarios
The five scenarios represent the possible states in which interactions between issuers and users are mediated. They also offer a framework for assessing the effectiveness of a form’s design through the lens of fairness. The next section examines the inherent relationships contained within each of these scenarios. This is achieved by graphically expressing Effort (E) against Opportunities (O). The results from this graphical expression visually reveal several correlations between users and issuers, design discrepancies, extent of cooperation, and user experience. Above all, the graph points to the optimum relationship conditions for fairness to occur in the design of digital government forms.